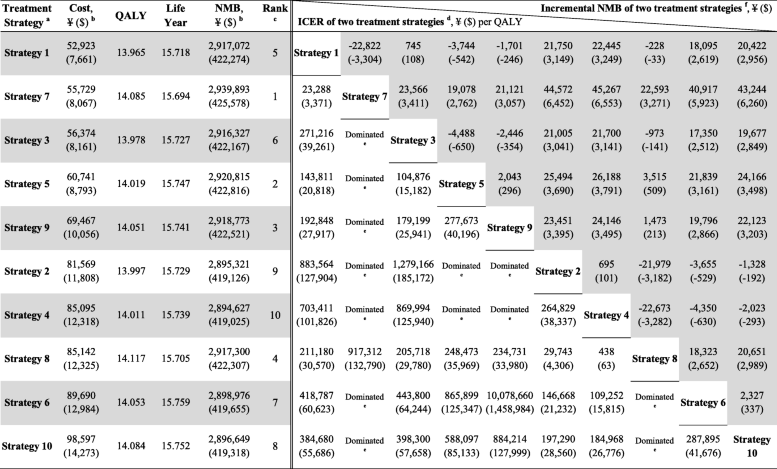
- Strategy 1: metformin → metformin + sulfonylurea → metformin + insulin. Strategy 2: metformin → metformin + sulfonylurea → metformin + GLP-1 receptor agonist. Strategy 3: metformin → metformin + thiazolidinedione → metformin + insulin. Strategy 4: metformin → metformin + thiazolidinedione → metformin + GLP-1 receptor agonist. Strategy 5: metformin → metformin + α-glucosidase inhibitor → metformin + insulin. Strategy 6: metformin → metformin + α-glucosidase inhibitor → metformin + GLP-1 receptor agonist. Strategy 7: metformin → metformin + glinide → metformin + insulin. Strategy 8: metformin → metformin + glinide → metformin + GLP-1 receptor agonist. Strategy 9: metformin → metformin + DPP-4 inhibitor → metformin + insulin. Strategy 10: metformin → metformin + DPP-4 inhibitor → metformin + GLP-1 receptor agonist
- DPP-4 dipeptidyl peptidase 4, GLP-1 glucagon-like peptide 1, ICER incremental cost-effectiveness ratio, NMB net monetary benefit, QALY quality-adjusted life-year
- aThe treatment strategies were presented in the order of ascending costs in this table. Detailed results of the 10 pharmacologic combination strategies were shown in Additional file 1: Table S8
- bFor the costs, data are 2019 Chinese yuan, ¥ (2019 US dollar, $). One US dollar was equal to ¥6.908 in 2019 [31]
- cThe strategies were ranked based on both the ICERs and the NMBs. The strategy ranking process based on the ICERs was presented in Additional file 1: Table S7. The larger the NMB value, the more cost-effective the strategy is. The ranking results based on the ICERs were equal to that based on the NMBs
- dResults of the ICER of two treatment strategies are presented in the triangle area in the lower left corner of the table. The data indicate row-to-column differences; for example, the ICER of strategy 7 vs. strategy 1 is ¥23,288 ($3371)/QALY
- e“Dominated” indicates a strategy (row) that is more costly and less effective than its comparator (column); for example, strategy 3 is dominated by strategy 7
- fResults of the incremental NMB of two treatment strategies are presented in the triangle area in the upper right corner of the table (gray area). The data indicate row-to-column differences; for example, the incremental NMB of strategy 1 vs. strategy 7 is − ¥22,822 (− $3304)
