Fig. 4
From: Clinical prediction models and the multiverse of madness
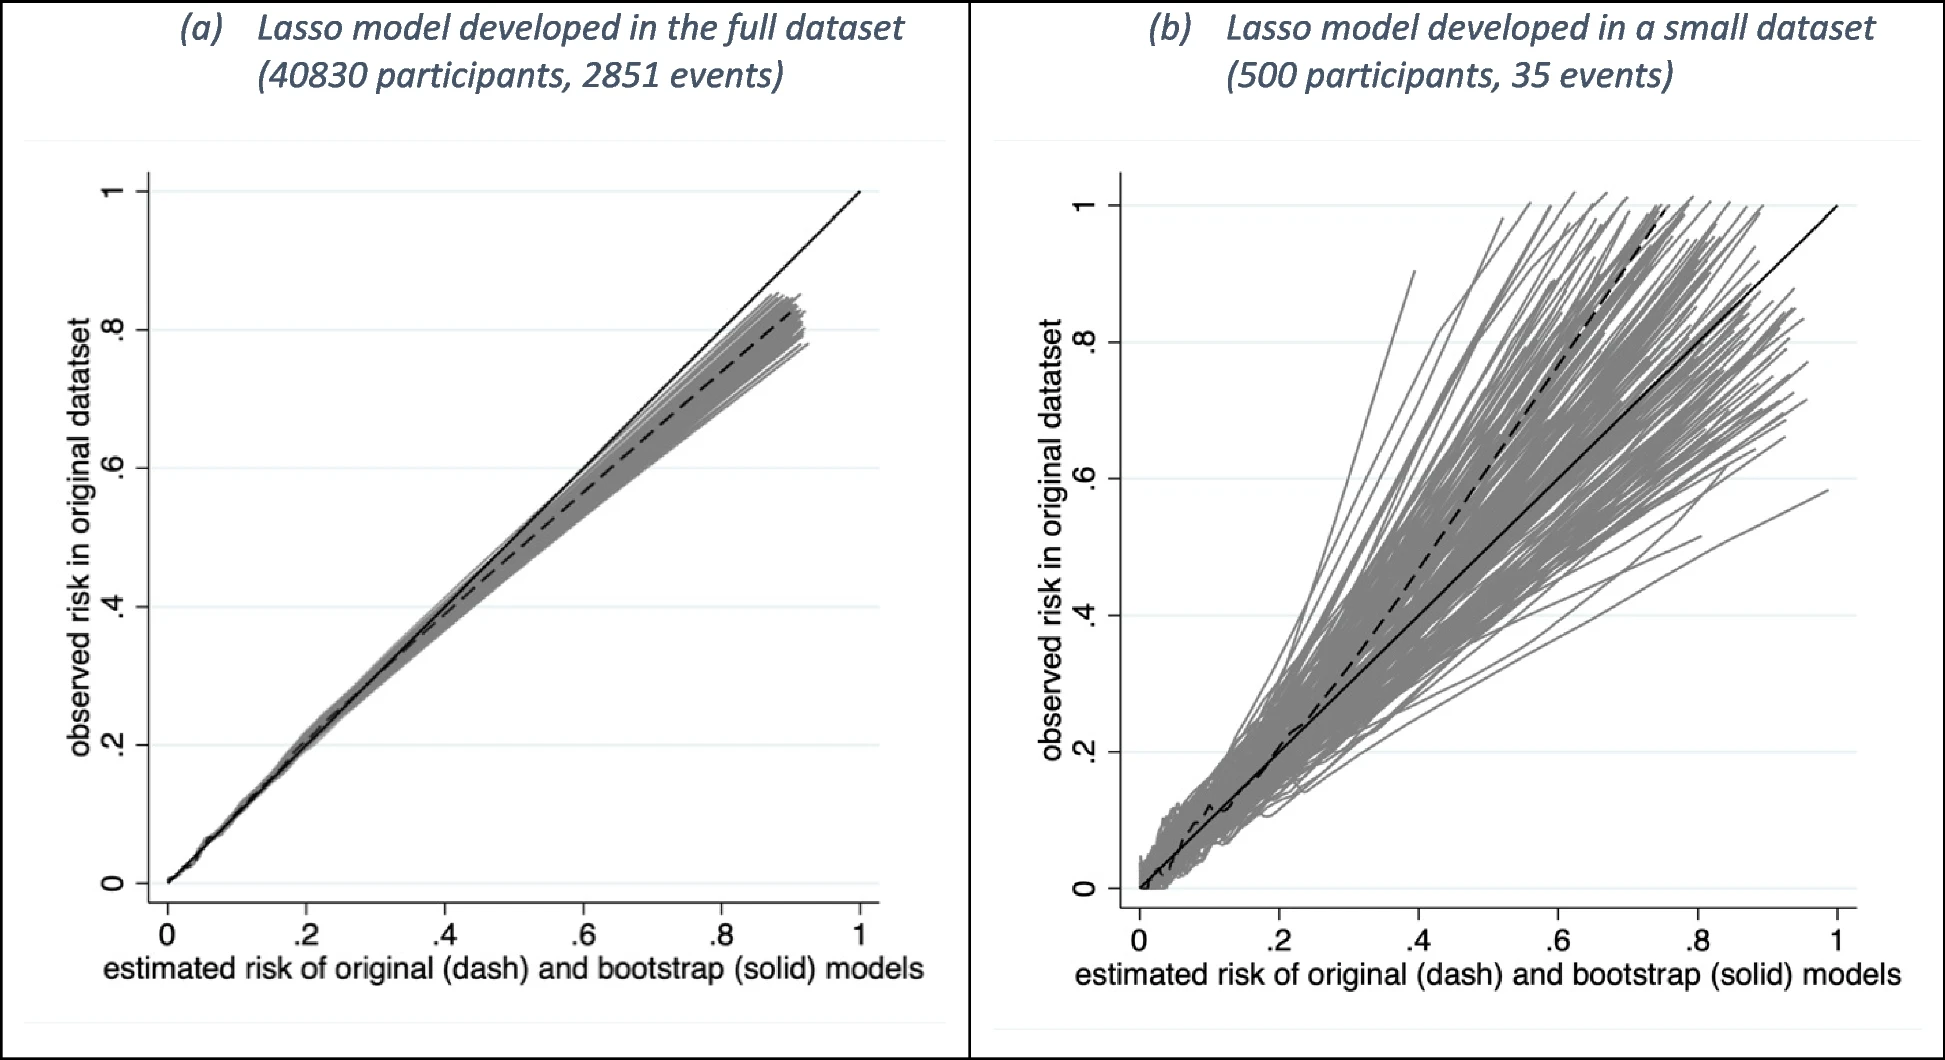
Calibration instability plot for a logistic regression model (with a lasso penalty) considering 8 predictors fitted in a the full sample of 40,830 participants (2851 deaths) and b a sub-sample of 500 participants (35 deaths). The solid diagonal line indicates ideal calibration. The dashed line indicates the calibration curve of the original model in the original sample. Others are the calibration curves of 200 bootstrap models applied in the original sample